

PHP 使用xdebug性能分析
查看php.ini
wenqidongdeMBP:src wenqidong$ php --ini
Configuration File (php.ini) Path: /usr/local/etc/php/7.1
Loaded Configuration File:         /usr/local/etc/php/7.1/php.ini
Scan for additional .ini files in: /usr/local/etc/php/7.1/conf.d
Additional .ini files parsed:      /usr/local/etc/php/7.1/conf.d/ext-opcache.ini

wenqidongdeMBP:src wenqidong$ vi /usr/local/etc/php/7.1/php.ini
添加xdebug配置
zend_extension="xdebug.so"
xdebug.remote_enable=1
xdebug.remote_connect_back=1
;xdebug.remote_host=
xdebug.idekey="PHPSTORM"
xdebug.remote_port=9009
zend_debugger.allow_hosts=127.0.0.1
zend_debugger.expose_remotely=always
zend_debugger.httpd_uid=-1
xdebug.trace_format = 2
xdebug.auto_trace = on
xdebug.auto_profile = on ;打开性能分析
xdebug.collect_params = on
xdebug.collect_return = on
xdebug.profiler_enable = 1
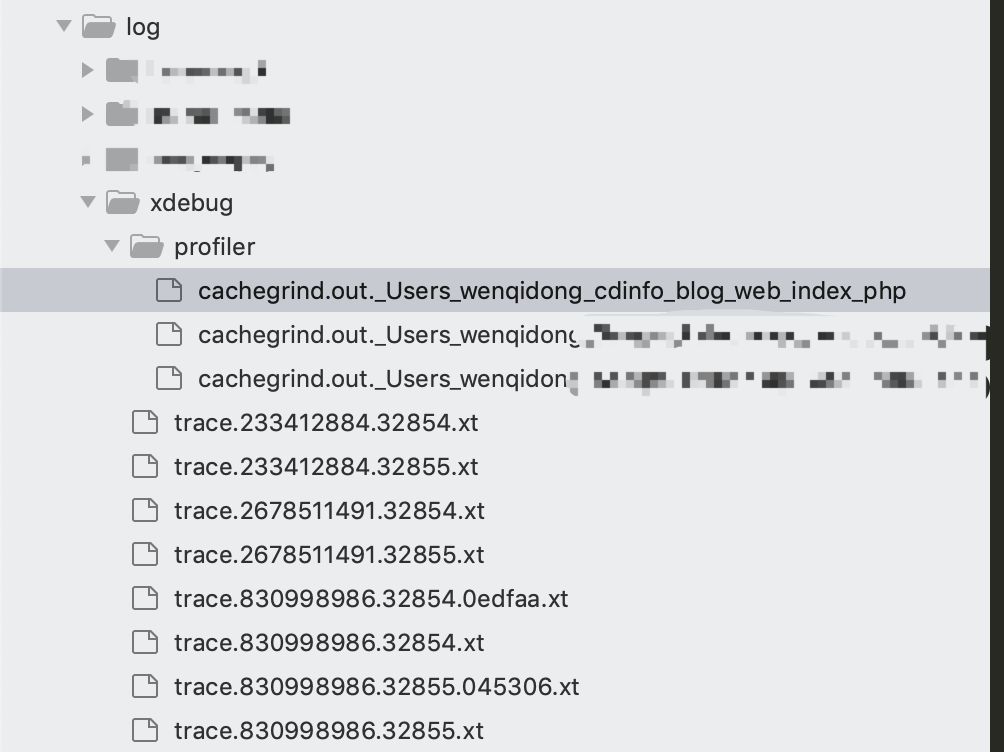
xdebug.trace_output_dir = /Users/wenqidong/log/xdebug
xdebug.profiler_output_dir= /Users/wenqidong/log/xdebug/profiler ;性能分析生成的文件目录
xdebug.trace_output_name = trace.%c.%p
xdebug.show_exception_trace = On ;开启异常跟踪
xdebug.show_local_vars = 0
xdebug.profiler_output_name=cachegrind.out.%s
xdebug.dump.GET = *
xdebug.dump.POST = *
xdebug.dump.COOKIE = *
xdebug.dump.SESSION = *
xdebug.var_display_max_data = 4056
xdebug.var_display_max_depth = 5设置好之后,测试一下参数是否有问题,没问题,则重启php-fpm
wenqidongdeMBP:~ wenqidong$ php-fpm -t
[23-May-2019 13:02:40] NOTICE: configuration file /usr/local/etc/php/7.1/php-fpm.conf test is successful

wenqidongdeMBP:~ wenqidong$ pkill php-fpm
wenqidongdeMBP:~ wenqidong$ php-fpm
[23-May-2019 13:02:50] NOTICE: [pool www] 'user' directive is ignored when FPM is not running as root
[23-May-2019 13:02:50] NOTICE: [pool www] 'group' directive is ignored when FPM is not running as root
wenqidongdeMBP:~ wenqidong$
在浏览器里访问一下本地的项目地址, 然后查看一下,配置文件中设置的调试报告保存目录,是否有文件生成,如果有文件生成,则继续安装工具查看报告数据。若没有文件生成,检查一下目录是否正确,目录需要手动创建,并且PHP需要读写权限。
安装qcachegrind, 使数据可视化
(1)brew install graphviz
    执行此命令安装graphviz,用来Call Graph功能
(2)brew install qcachegrind
    安装qcachegrind
安装完qcachegrind后,提示设置几个环境变量,这里我没有设置。
...
For compilers to find qt you may need to set:
  export LDFLAGS="-L/usr/local/opt/qt/lib"
  export CPPFLAGS="-I/usr/local/opt/qt/include"

For pkg-config to find qt you may need to set:
  export PKG_CONFIG_PATH="/usr/local/opt/qt/lib/pkgconfig"
找到qcachegrind的位置,然后直接运行
wenqidongdeMBP:~ wenqidong$ find / -name qcachegrind
find: /usr/sbin/authserver: Permission denied
/usr/local/bin/qcachegrind
/usr/local/var/homebrew/linked/qcachegrind
find: /usr/local/var/run/nginx/scgi_temp: Permission denied
find: /usr/local/var/run/nginx/uwsgi_temp: Permission denied
find: /usr/local/var/run/nginx/proxy_temp: Permission denied
find: /usr/local/var/run/nginx/fastcgi_temp: Permission denied
find: /usr/local/var/run/nginx/client_body_temp: Permission denied
find: /usr/local/mysql-5.7.19-macos10.12-x86_64/keyring: Permission denied
find: /usr/local/mysql-5.7.19-macos10.12-x86_64/data: Permission denied
/usr/local/opt/qcachegrind
/usr/local/Cellar/qcachegrind
/usr/local/Cellar/qcachegrind/18.04.3_1/bin/qcachegrind
/usr/local/Cellar/qcachegrind/18.04.3_1/qcachegrind.app/Contents/MacOS/qcachegrind
^C
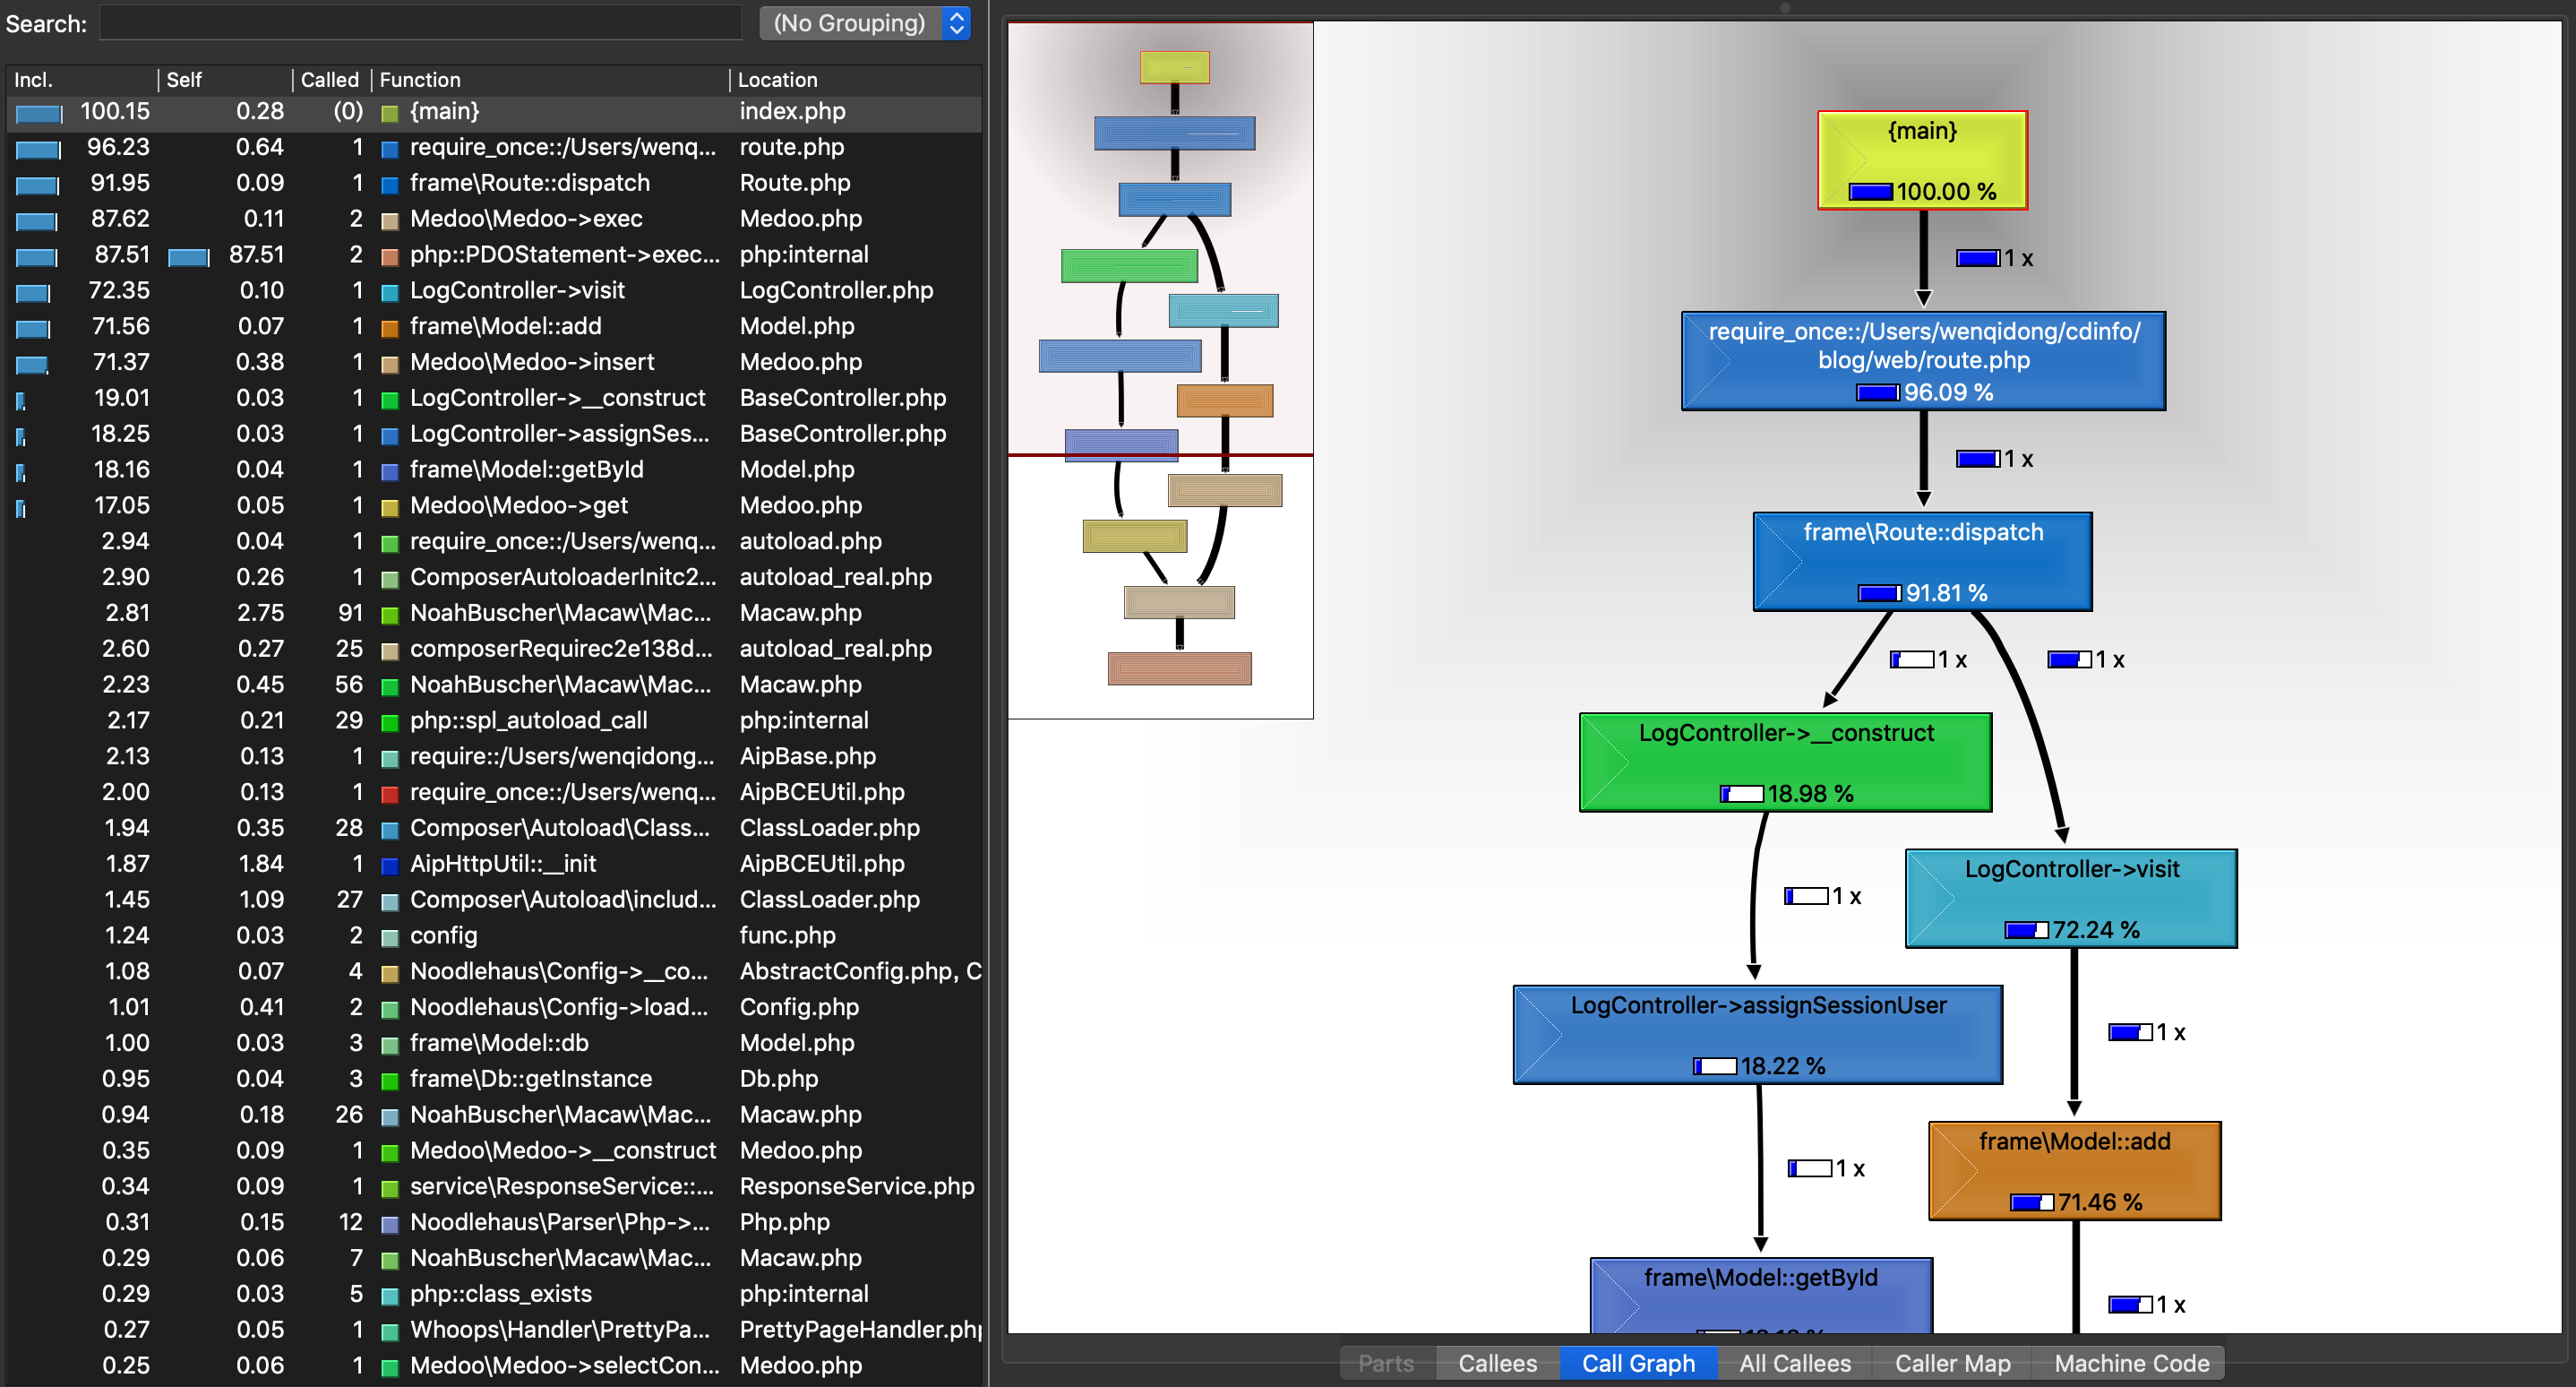
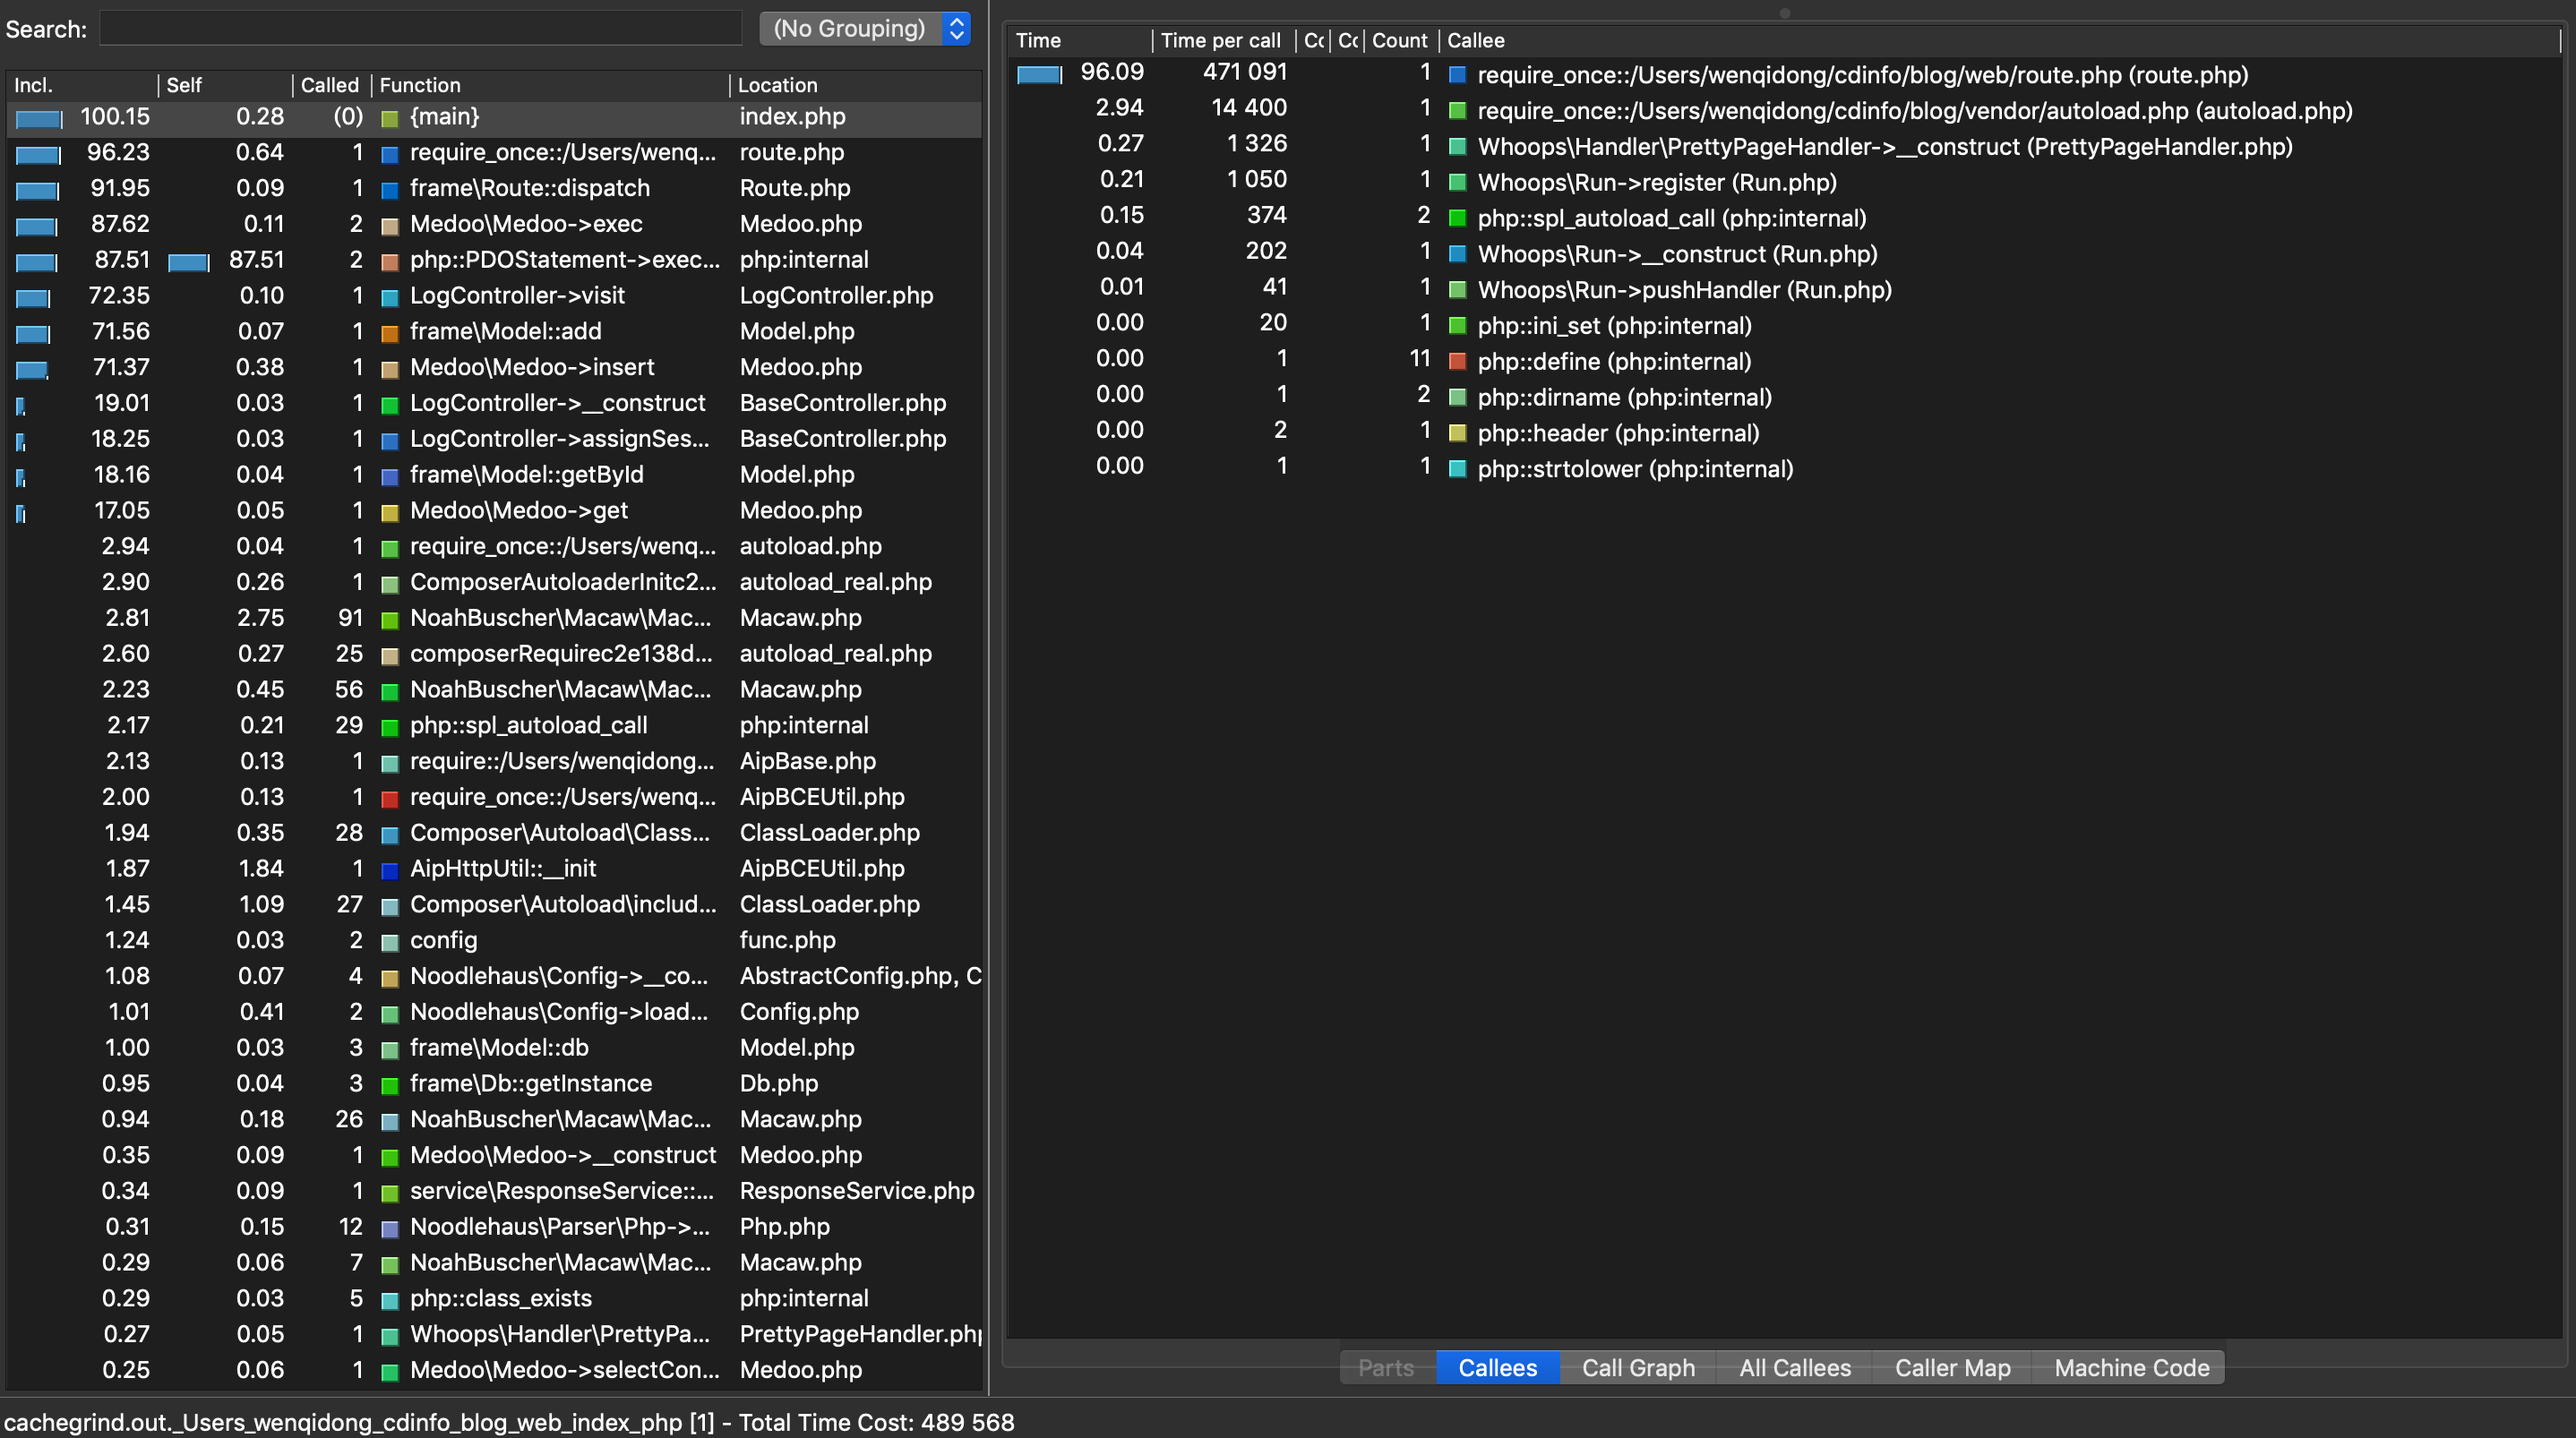
wenqidongdeMBP:~ wenqidong$ /usr/local/bin/qcachegrindmac会打开一个窗口,在打开的窗口中打开一个profiler文件,就可以查看访问那个文件时,整个PHP的加载时间,函数的调用次数等..如下图所示: